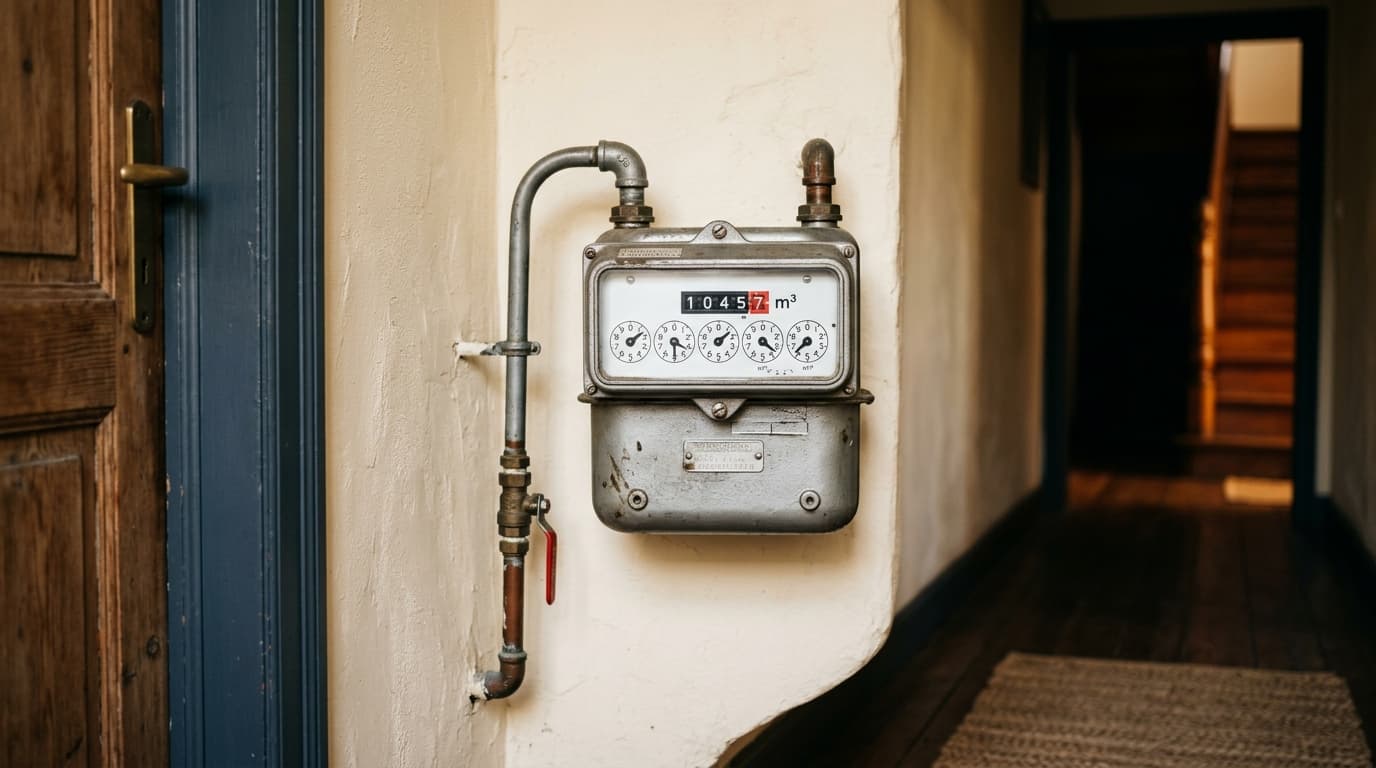
The same number turns up on every quote and every comparison tool: 17,000 kWh. That is the annual gas consumption of the "average" Belgian household. The trouble is that almost nobody consumes exactly that — and using the figure to estimate your own bill often leaves you several hundred euros off. Here is where the benchmark comes from, what it actually covers, and how to replace it with your own number.
What is the average gas consumption of a Belgian household?
17,000 kWh per year — the standard residential reference profile in Belgium.
The figure corresponds to profile D3a, defined by the CREG, the federal regulator. It describes a household using gas for heating, domestic hot water and possibly cooking. Regulators and comparison sites use this profile to line up supplier price grids on a common basis.
In real life the spread is wide. Depending on housing type, insulation quality and the number of occupants, a Belgian household usually falls somewhere between 12,000 and 25,000 kWh a year.
17,000 kWh
Standard residential profile (CREG, D3a)
~1,450 m³
Equivalent in cubic metres
12,000 – 25,000
Actual observed range (kWh/year)
Why did the reference figure drop from 23,260 to 17,000 kWh?
Because Belgian homes use considerably less gas than they did fifteen years ago.
The former reference profile, D3, was set at 23,260 kWh a year. The CREG replaced it with profile D3a at 17,000 kWh for its residential price analyses. The revision is not cosmetic: it acknowledges a drop of roughly 27% in the typical household's consumption.
Several factors compound:
- insulation has improved, driven by building standards and renovation grants;
- condensing boilers have replaced a generation of far less efficient appliances;
- programmable thermostats and thermostatic valves have removed a good share of pointless heating;
- the 2022 price crisis durably changed habits — many households never turned their thermostat back up.
The CREG has continued this work: its study F20251023 (2025) on standard consumption profiles in Belgium and neighbouring countries developed new reference profiles, designed to better reflect the diversity of households and the arrival of heat pumps. They will be phased into its analyses.
The typical household has shed 6,000 kWh in a decade. If your mental benchmark predates that, it is wrong.
How much gas does each housing type use?
From 600 m³ for an apartment to over 2,000 m³ for a detached house — a ratio of one to three.
This is the most useful breakdown, because the geometry of the building matters more than anything else. The commonly observed ranges in Belgium:
| Housing type | Annual volume | Equivalent energy |
|---|---|---|
| Apartment | 600 – 900 m³ | 7,000 – 10,500 kWh |
| Terraced house | 1,000 – 1,400 m³ | 11,600 – 16,300 kWh |
| Detached house | 1,500 – 2,200 m³ | 17,400 – 25,600 kWh |
For the same floor area, a house uses 1.4 to 2 times more gas than an apartment. The explanation fits in one sentence: a detached house exposes four walls, a roof and a floor to the cold, while a mid-floor apartment exposes one or two façades and is surrounded by heated homes. Your neighbours heat you, literally.
Find the line that matches your home and forget the national average: that line is your reference point.
How do you convert your m³ of gas into kWh?
Multiply your m³ by the conversion coefficient printed on your annual bill.
Your meter measures a volume, in cubic metres. Your supplier bills energy, in kilowatt-hours. Between the two, a conversion coefficient translates the gross calorific value of the gas delivered to you — the heat released by its complete combustion.
Two families of gas circulate on the networks:
- high-calorific gas (H), with a coefficient around 11.6 kWh/m³;
- low-calorific gas (L), around 10.3 kWh/m³.
A concrete example: 1,500 m³ × 11.6293 = 17,444 kWh.
How do you calculate your own gas consumption?
By taking two meter readings twelve months apart — or simply by reading your annual statement.
The most reliable method is also the simplest: your annual settlement bill already states your consumption in kWh for the past year. That is the figure to enter into any comparison tool.
If you want to check it or track consumption during the year:
- Read the index on your meter (in m³) and note the date.
- Read it again later and take the difference.
- Multiply that volume by the conversion coefficient from your bill.
- Scale to a full year if your period is shorter — bearing in mind that an extrapolation made in January will overstate badly, and one made in July will understate just as badly.
If you have a digital meter, your consumption data is available without any manual reading, at a much finer time resolution. We cover how it works in our article on the digital meter in Belgium.
What does average gas consumption cost in 2026?
Between roughly €1,310 and €2,124 a year in Wallonia for 17,000 kWh — depending on the contract, not on the consumption.
This is the most useful finding in the whole article. For strictly identical consumption of 17,000 kWh a year in Wallonia, the annual bill ranged in July 2026 from roughly €1,310 to €2,124 depending on the contract signed. More than €800 of difference, for the same gas, delivered over the same network, in the same house.
For reference, the average price of a kWh of gas in Belgium was around 5.3 cents in mid-March 2026, with Walloon grids ranging from 4.44 to 7.47 cents in July 2026.
✓ Pros
- Knowing your real consumption lets you compare on total annual cost
- The gap between contracts far exceeds the effect of tax increases
- Switching supplier is free and involves no interruption
✗ Cons
- The price per kWh alone says nothing about the fixed annual standing charge
- Variable offers are reindexed every month
- An estimate based on the national average distorts the calculation if your home does not match it
What makes up that amount — excise duties, distribution tariffs, the competitive share — is broken down in our analysis of the price of gas in Belgium in 2026. And to turn your consumption into genuinely comparable offers, our ranking of energy suppliers works on total annual cost rather than headline price per kWh.
What really drives your consumption up or down?
Insulation first, the geometry of the home second, habits last.
A well-insulated home uses 30 to 50% less gas than a poorly insulated one of comparable size. No thermostat setting compensates for a gap of that size: it is by far the leading factor.
Then come:
- the building type (the one-to-three ratio above);
- the age and efficiency of the boiler;
- the number of occupants — mainly through hot water;
- the severity of the winter, which easily explains 10 to 15% of variation from one year to the next with nothing having changed in your home.
The target temperature, finally, weighs more than people assume: each degree lower saves in the order of 7% of heating consumption.
Is your gas consumption abnormal?
Compare it to the benchmark for your housing type, never to the national average.
If you exceed the top of your category's range by more than 30%, there is probably a physical cause to look for:
- failing insulation — roof and window frames first;
- an old or badly tuned boiler;
- an oversized or poorly insulated hot water tank.
A sudden, unexplained increase warrants having the installation checked: a gas leak is rare, but it cannot be diagnosed from a spreadsheet.
Conversely, if you sit within your category's range, your consumption is not the problem. Your contract might be: that is where the hundreds of euros are decided. Our guide to understanding your energy bill will help you spot what you are actually paying for.
Key takeaways
Every figure quoted here is dated — CREG profile D3a, CREG study F20251023 from 2025, average price from March 2026, Walloon grids from July 2026 — and variable offers are reindexed monthly: check them again before you sign. Start by taking your real consumption from your latest annual statement, place it within the range for your housing type, then look at which energy supplier matches your profile. Consumption within the norm on a bad contract costs more than high consumption on a good one.
Sources — CREG: standard residential profile D3a (17,000 kWh) and former profile D3 (23,260 kWh); CREG study F20251023 (2025) on standard consumption profiles in Belgium and neighbouring countries. Average price per kWh of gas from March 2026 and Walloon tariff cards from July 2026 as cited in the article. Pages accessed 18 August 2026. Variable offers are reindexed every month: re-check the amounts at the moment you sign.
Gaz naturel comparator
Compare all gaz naturel side by side.
Compare now →
Frequently asked questions
Camille suit le marché belge de l'énergie depuis une dizaine d'années. Elle a d'abord travaillé côté gestion de contrats B2B, puis est passée à l'analyse indépendante : elle éplucha les grilles tarifaires de Mega, Bolt, Engie, Luminus, TotalEnergies, Eneco ou Ecopower, recoupe chaque prix avec le CREG Scan, la CWaPE, le VREG et Brugel, et refait les calculs de facture à la main quand un fournisseur communique un chiffre trop rond. Sa conviction : la plupart des ménages belges ne changent jamais de fournisseur et paient chaque année quelques centaines d'euros de trop — pas par paresse, mais parce que les offres sont volontairement illisibles. Ici, elle traduit les conditions tarifaires en euros par an, et dit clairement quand une « promo » n'en est pas une.